Raman Spectroscopy
Raman spectroscopy is a technique commonly used to identify molecules in the field of Chemistry by their vibrational, rotational and other low-frequency modes. It takes the help of spectroscopy, the interaction of matter with electromagnetic radiation, to show its results.
History
The Raman Effect was discovered in 1928 by the Indian physicists Sir C.V. Raman and K.S. Krishnan, who identified the effect in liquids causedf by sunlight. A narrow band photographic filter was used to produce monochromatic light. The phenomenon was observed when some rays of that light managed to pass through a crossed filter which was originally meant for blocking the rays. Raman received the Nobel Prize in Physics in 1930 for his pioneering discovery.
How Does Raman Spectroscopy Work – The Raman Effect
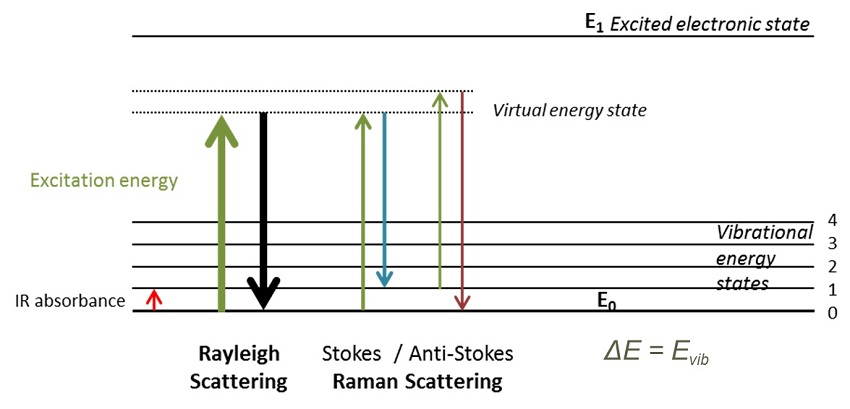
The process involves the inelastic scattering of a beam of monochromatic light by a sample material. Usually, a laser is used for generating this light that interacts with vibrating molecules, phonons or other stimulations in the system. This results in shifting the energy level of the laser photons to oscillate up and down and give information about the vibration patterns of the system, a phenomenon called the Raman Effect. It may be mentioned here that the infrared spectroscopy gives us a similar but complementary knowledge.
Raman Spectrometer
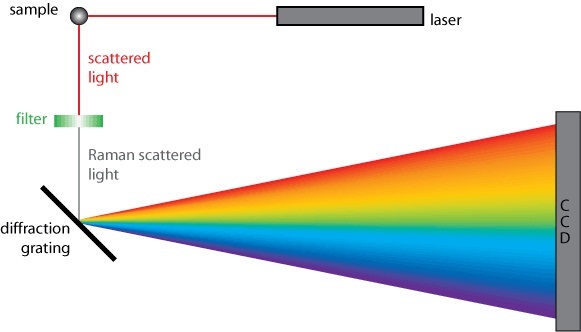
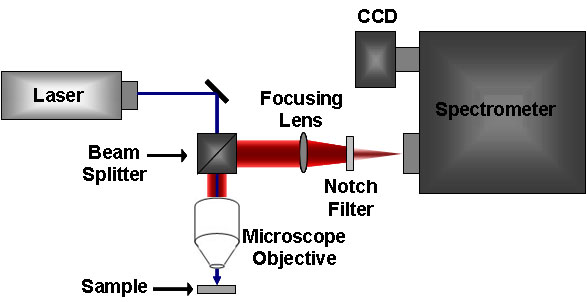
This instrument contains the laser source, the sample and has the necessary apparatus to detect the Raman spectrum. The dispersive Raman spectrometers use a spectrograph or a monochromator as the wavelength selector in the visible range. On the other hand, Fourier Transform (FT) Raman Spectrometers use powerful lasers, eliminate fluorescence problems in the spectrum without degrading the sample.
The portable handheld Raman Spectrometers are used conveniently in industries for quality control of raw materials. They neither need to be in contact with the sample nor require the latter to be pre-treated. Sometimes a Raman probe head is connected to a spectrometer to perform in situ Raman analysis of a sample in industrial settings.
Raman Spectrum and Raman Shift Basics
It should be borne in mind that the major part of the scattered light is of a frequency same as that of the excitation source, known as Rayleigh scattering. A very small amount, however, have frequencies that differ. When such frequencies are graphically plotted against their intensity, it gives rise to the Raman Spectrum. The scaling is made by keeping the frequency of Rayleigh scattering or that of the laser beam at the origin. Now the Raman Shift, i.e., the frequency difference of the inelastically scattered radiation from that of the source, is plotted along the X-axis.
Since the said shift is just a difference, it remains unaffected by the value of incident radiation. A look at the spectrum reveals that there are a series of peaks in the graph for different substances that act as the sample. As each material peaks differently, this offers us a way to differentiate between them.
Raman Spectroscopy Video
The method is explained clearly in this video cum animation.
One of the disadvantages of Raman spectra is that they are usually very weak in intensity compared to that of Rayleigh scattering. Hence detecting it becomes difficult. Below are a few techniques to strengthen the spectrum.
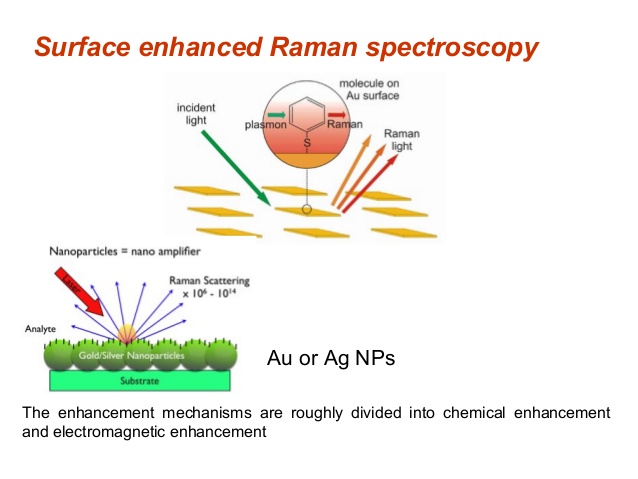
Surface Enhanced Raman Spectroscopy (SERS)
Intensity can be increased by orders of 104 to 1014 using the technique, Surface Enhanced Raman Spectroscopy (SERS) that can detect even single molecules. This gain is brought about by subjecting Raman spectroscopy to a metal surface of nanoscale roughness having molecules from the sample adsorbed in it or within a few Angstroms of the said surface. SERS observation is strongest in silver though it can be applied to gold, copper and other excitation sources as well. However, its effect on other metals is insignificant.
Coherent Anti-Stokes Raman Spectroscopy (CARS)
Coherent Anti-Stokes Raman Spectroscopy can produce intensities of orders of magnitude higher than the spontaneous Raman scattering. It induces molecular vibrations by employing multiple photons to generate a coherent signal. This non-linear optical process of the third order involves a triplet of laser beams, a Stokes beam of frequency ωs, a pump beam of frequency ωp and a probe beam with frequency ωpr. On interacting with the sample, they generate an anti-Stokes frequency of ωpr+ωp-ωs.
Tip-Enhanced Raman Spectroscopy (TERS)
This advanced SERS technique uses the tip of an approximate atomically sharp pin that is coated with an SERS-active metal or its nanoparticles, e.g., gold. The TERS effect occurs within the immediate neighborhood of the tip resulting in a signal with a resolution of nearly the size of the tip apex (20nm -30 nm).
Resonance Raman (RR) Spectroscopy
This method involves choosing the incident wavelength in such a way so as to overlap with an electronic transition of the molecules or crystals of the sample. It is useful for studying the structures of large molecules such as that of polypeptides. However, there are limitations in the viewing of the spectrum as the associated UV-visible absorption fluorescence may interfere with the emission.
In another variant, the Stimulated Raman Spectroscopy, two laser beams are made to coincide with the sample. If the resulting Raman shift matches the frequency of a particular molecular vibration, signal amplification is produced.
In Spatially Offset Raman Spectroscopy, spatially offset measurements are used to accurately analyze the chemical structure of matter beneath obscuring surfaces. A new ultrafast technique, called Femtosecond Stimulated Raman Spectroscopy provides the relevant information with high spectral and temporal resolutions.
Applications
Microscopic Analysis – Micro-Raman Spectroscopy uses a specialized Raman spectrometer integrated within a Raman microscope to make space and time resolved spectral measurements of microscopic samples. The confocal design of the latter instrument comes in handy since it enables a very small area to be analyzed in the micron scale. This, along with XYZ movement and automated focusing can produce the chemical images of a sample while examining minerals, polymers, ceramics, cells, forensic trace evidence, etc.
Detecting Crystal Structure – In Polarized Raman Spectroscopy, spectra are obtained after polarization, either parallel or perpendicular to the incident polarization that yields useful information on the molecular orientation and shape of ordered substances such as crystals.
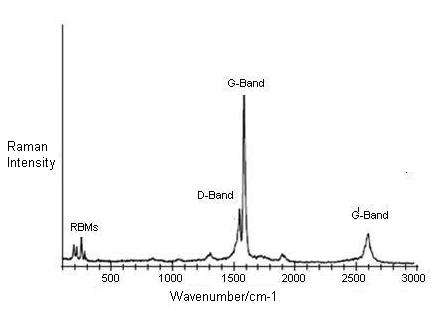
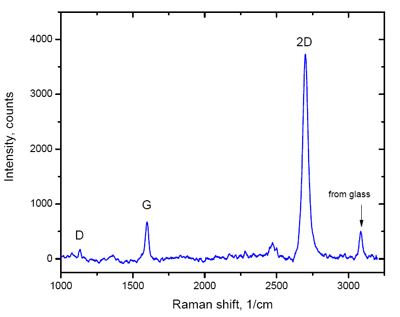
Use in Nanoelectronics – Raman Spectroscopy of Graphene and related materials like carbon nanotubes (CNT) and graphite has enabled the scientific community to learn about their properties for gaining an advantage in nanoelectronics and in making nano-sensors, next-generation transistors, transparent electrodes, etc. The method is also beneficial for determining blood glucose concentration in a non-invasive manner.
Other Uses – Transmission Raman Spectroscopy helps to examine bulk contents of diffusely scattering substances like powders and tissues.
Raman spectroscopy was an important discovery that has made substantial contributions in the fields of Physics and Chemistry though it is not devoid of limitations. These include fluorescence disturbance from impurities in a sample and intense laser heating of the same resulting in the destruction of the sample or covering of the spectrum in extreme cases.
-
References
Article was last reviewed on Friday, February 17, 2023
Related articles


Join our Newsletter
Fill your E-mail Address