Diesel Cycle
The Diesel cycle is an essential concept in thermodynamics and internal combustion engines. It plays a crucial role in operating compression ignition engines, known as Diesel engines. The Diesel cycle is a thermodynamic cycle describing the conversion of fuel energy into useful work. Understanding the basics of the Diesel cycle is essential to understanding the mechanics and thermodynamics of these powerful machines.
German inventor and mechanical engineer Rudolf Diesel invented the Diesel engine in 1893.
Thermodynamic Process
The Diesel cycle consists of four main stages: intake, compression, power, and exhaust. Each stage has unique characteristics, contributing to the engine’s overall thermal efficiency and performance.
1. Intake Stroke
During the intake stroke, the engine’s piston moves downward from the top dead center (TDC) to the bottom dead center (BDC) within the cylinder. The intake valve opens to allow air (not fuel) to enter the cylinder from the surrounding environment. The air is drawn in due to the partial vacuum created as the piston moves downward. This mixture is crucial for the combustion process as it provides the oxygen necessary for the subsequent stages. This stage is represented by 0 → 1 in the PV diagram below.
2. Compression Stroke
Once the intake stroke is complete, the intake valve closes. With the piston at the BDC, it begins to move back upwards toward TDC, compressing the air adiabatically within the cylinder. This compression raises the temperature and pressure significantly and reduces the volume. This stroke is represented by 1 → 2 in the PV diagram. At the end of this stroke, fuel is injected and forms an air-fuel mixture with the hot air.
3. Power Stroke
The compressed air-fuel mixture is ignited as the piston reaches the TDC at the end of the compression stroke. Unlike gasoline engines, where a spark plug initiates the ignition, Diesel engines rely on the heat generated by the high pressure in the cylinder to ignite the mixture. When the mixture ignites, it rapidly expands, creating a massive amount of hot, high-pressure gases. These gases force the piston down with high force, turning the crankshaft connected to the piston. The mechanical energy generated by the piston’s movement is the engine’s primary power source. This process is represented by 2 → 3 → 4 in the PV diagram.
4. Exhaust Stroke
After the power stroke, the piston reaches the BDC of its stroke again. The exhaust valve opens, allowing the high-pressure hot exhaust gases to exit the cylinder and flow into the exhaust system. The piston then moves back up, pushing the remaining exhaust gases out of the cylinder and cooling the engine. This process clears the cylinder of the spent gases and readies it for the next intake stroke. This step is represented by 4 → 1 → 0 in the PV diagram.
Once the exhaust stroke is complete, the cycle repeats itself. The engine continually goes through these four stages to convert chemical energy in the diesel fuel into mechanical energy that can be used to power vehicles, machinery, and other applications.
PV Diagram
The pressure-volume (PV) diagram of the Diesel engine cycle consists of two adiabatic lines (representing the compression and expansion processes) and two horizontal lines (representing the heat addition and rejection processes). The cycle moves clockwise in the PV diagram, exemplifying how the engine’s state changes through the four stages, represented by points 0, 1, 2, 3, and 4 in the image below.
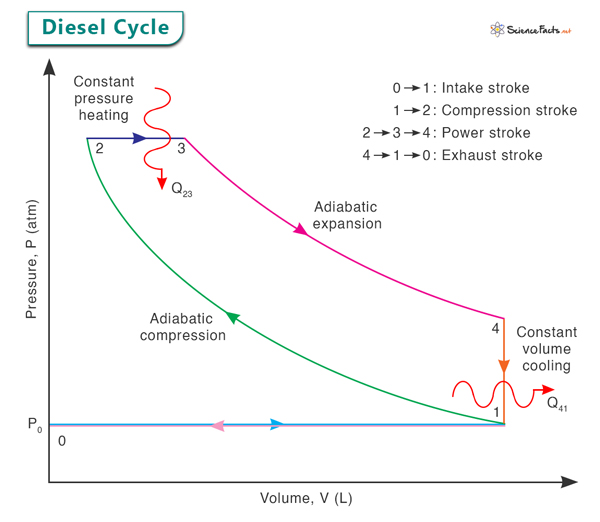
Process 1 → 2: Adiabatic Compression
The cycle begins with the intake stroke, where fresh air is drawn into the cylinder as the piston moves downwards. As the piston starts moving upwards during the compression stroke, the intake valve closes, and the rising piston compresses the air adiabatically. This compression increases both the pressure and temperature of the air.
Process 2 → 3: Constant Pressure Heating
Fuel is injected into the cylinder once the air is highly compressed at point 2. The heat of compression and the introduction of fuel lead to spontaneous ignition due to the high temperature and pressure. The fuel burns at approximately constant pressure, rapidly increasing temperature. This phase corresponds to the first part of the power stroke, where the expanding hot gases push the piston down.
Process 3 → 4: Adiabatic Expansion
As the fuel is consumed and the combustion gases expand, the piston continues its downward movement. The expanding gases perform adiabatic work on the piston, which is converted into mechanical energy. The pressure and temperature of the gases decrease as they do work.
Process 4 → 1: Constant Volume Cooling
Once the exhaust valve opens and the piston starts moving upwards, the burnt gases are expelled from the cylinder. The cylinder is full of exhaust gases, and the piston moves back up, compressing these gases. Since the exhaust valve is open, there is no change in volume during this phase, leading to constant volume cooling. The temperature and pressure drop further as the gases cool down.
By analyzing these pressure-volume changes on the PV diagram, we can calculate various parameters such as work done, thermal efficiency, and power output.
Thermal Efficiency
The thermal efficiency of a Diesel engine refers to the ratio of the useful mechanical energy output obtained from the engine’s power stroke to the energy input in the form of fuel. In other words, it measures how effectively the engine converts the chemical energy stored in the fuel (Diesel) into useful mechanical work.
Mathematically, the thermal efficiency (η) of a Diesel engine can be calculated using the following formula:
According to the first law of thermodynamics, the net change in internal energy is zero for a closed cycle, resulting in the following equation.
W = Q23 + Q41
The efficiency equation can be written as
Heat is added to during the constant-pressure (isobaric) process 2 → 3 and is given by
Qin = Q23 = CP(T3 – T2)
Where
CP is the specific heat constant at constant pressure.
T2 and T3 are the temperatures at points 2 and 3, respectively.
Heat is rejected during the constant-volume (isochoric) process 4 → 1 and is given by
Q41 = Cv(T1 – T4)
Where
CV is the specific heat at constant volume.
T1 and T4 are the temperatures at points 1 and 4, respectively.
Plugging in the expressions for Q23 and Q41 in the thermal efficiency equation
An ideal air-standard Diesel engine undergoes four distinct phases, each of which can be individually examined. Out of the cycle’s four phases, two of them are adiabatic processes. Therefore, it is necessary first to write down the adiabatic relationships before proceeding. These adiabatic relationships are as follows:
Based on the above relationships, we obtain the following adiabatic equations.
Process 1 → 2
Where
γ is the adiabatic index (= CP/CV).
V1 and V2 are the volumes at points 1 and 2, respectively.
r is the compression ratio (= V1/V2).
The compression ratio is the ratio of the combustion chamber’s volume when the piston is at the BDC to the volume at the TDC, measured during the compression stroke. In other words, it is the ratio of the maximum volume to the minimum volume in the combustion chamber of a Diesel engine.
Process 3 → 4
Where
V3 and V4 are the volumes at points 3 and 4, respectively. V4=V1.
Rewriting the efficiency expression, we get
Let us define a term called fuel cut-off ratio α as the volume after combustion to the volume before combustion.
Applying the ideal gas equation, PV = nRT, to the above
Therefore,
Also,
The efficiency expression comes down to
The value of γ remains constant for automobile engines as the ratio of the two specific heats for air is about 1.4. As observed, the equation above illustrates the correlation between the thermal efficiency of the diesel cycle and the compression and cut-off ratios. A rise in the cut-off ratio leads to a reduction in the thermal efficiency of the diesel cycle. Conversely, increasing the compression ratio results in an improvement in the thermal efficiency.
-
References
Article was last reviewed on Friday, September 29, 2023
Related articles


Join our Newsletter
Fill your E-mail Address