PV Diagram
A pressure-volume (PV) diagram is a graphical way of representing the relationship between the pressure and volume of an ideal gas. A PV diagram is drawn for a thermodynamic process occurring in a closed system, where there is no exchange of matter and energy between the system and its surroundings. The relationship between pressure and volume is causal, meaning a change in one results in a change in the other.
Pressure and Volume Relationship
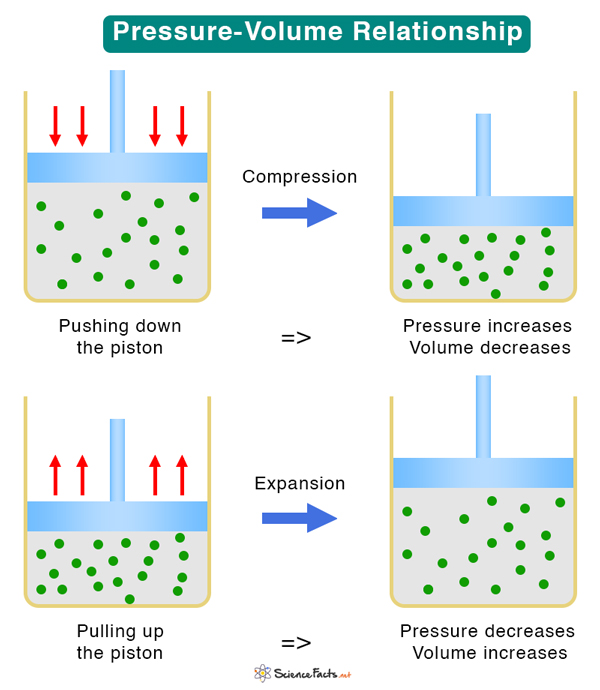
To understand the pressure-volume relationship, consider a sealed container containing an ideal gas, as shown in the image below. It has a piston that, upon application of force, moves up and down to expand and compress the gas. The container, piston, and gas together comprise a thermodynamic system. If the piston moves down, the pressure increases, and the volume decreases. If the piston moves up, the pressure decreases, and the volume increases. Therefore, an increase in one quantity results in a decrease in the other.
Types of PV Diagrams
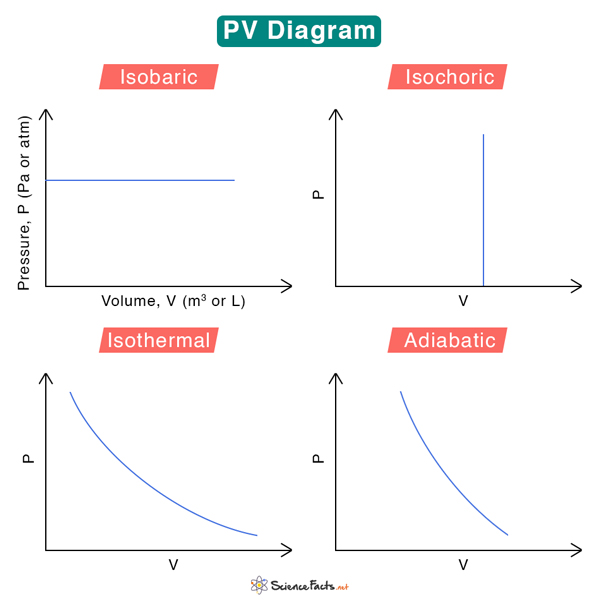
We can associate four general thermodynamic processes with the container-piston system above.
1. Isobaric – when the gas is held at a constant pressure
2. Isochoric – when the gas is held at a constant volume
3. Isothermal – when the gas is held at a constant temperature
4. Adiabatic – no heat flows in and out of the container
These fundamental processes are modeled on PV diagrams and follow ideal gas laws. Each process has its unique PV diagram, as shown below.
How to Draw a PV Diagram
Now that we have seen a few PV diagrams, let us understand how to draw them. Here are some fundamental rules that we must follow:
1. Pressure is plotted along the vertical axis, and volume is plotted along the horizontal axis.
2. The pressure increases from bottom to top, and the volume increases from left to right.
3. An arrow can be added to the curve to indicate the direction of the process.
Steps for Drawing a PV Diagram
1. Identify the process: The first step is to understand for which thermodynamic process we are drawing a PV diagram.
2. Look for indicators: Identify signs that say something about the process. For example, “the gas pressure doubles”, ”the volume remains constant”, and “the temperature decreases”. These will be useful in determining the direction of the process.
3. Learn the direction: Understand the direction in which the process occurs. For example, if a gas compresses, it goes from low pressure to high pressure or high volume to low volume. Also, if compression is in one direction, expansion is in the opposite direction.
4. Calculate unknown variables: Each thermodynamic process is governed by an ideal gas law describing the relationships between pressure, volume, and temperature. Use the appropriate equation to determine the unknown variable. These quantities will help to understand the direction.
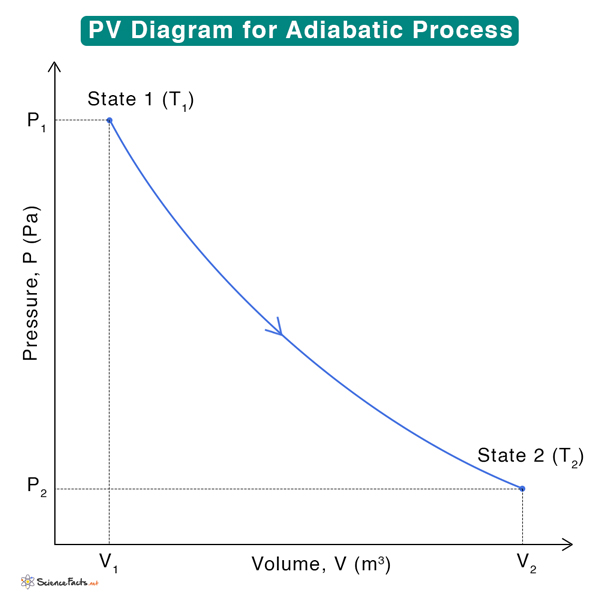
5. Arrange the state variables: After determining the unknown quantities, arrange the state variables according to the order of their states. For example, state 1 has pressure P1, volume V1, and temperature T1, and state 2 has pressure P2, volume V2, and temperature T2. Suppose a system goes from state 1 to 2. Then, draw a line connecting the two states after identifying the process from step 1.
Below is an example of a PV diagram during adiabatic compression of an ideal gas. Each point on the curve represents a thermodynamic state with unique P, V, and T values.
How to Calculate Work Done from PV Diagram
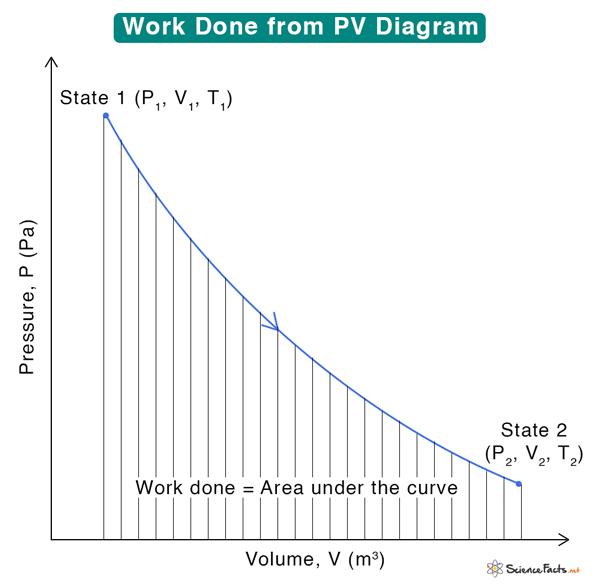
A PV diagram contains much information about the system and the various thermodynamic processes involved. Using it, we can calculate the change in internal energy, heat exchanged between the system and the surroundings, and work done. To determine work, we must integrate and calculate the area under the PV curve.
The sign conversion used for W is as follows:
W > 0: Work is done on the system or compression
W < 0: Work is done by the system or expansion
W = 0: No work is done or isochoric process
Applications
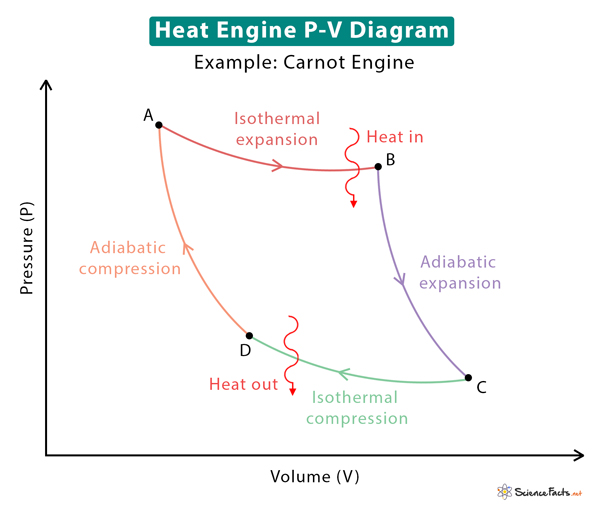
The significant application of a PV diagram is to study heat engines. These heat engines operate on cycles comprising a combination of various thermodynamic processes. These diagrams explain how pistons in internal and external combustion engines move, change the pressure and volume of the working fluid, and produce work. The work done by the engines is utilized to move a vehicle or create electricity. Some well-known heat engine cycles are the Carnot cycle, Otto cycle, and Rankine cycle. The image above shows the PV diagram for the Carnot cycle. Included in the diagram are the various thermodynamic processes.
-
References
Article was last reviewed on Wednesday, February 1, 2023
Related articles


Join our Newsletter
Fill your E-mail Address