Potential Energy Graph
The change in potential energy with an object’s position can be plotted as a graph. Such graphs are known as potential energy graphs. By plotting potential energy against the position, one can learn the various physical properties of the system. A system will try to minimize its potential energy to achieve stability. Let us look at a few real-life examples that can be studied from potential energy graphs.
Free Falling Objects Near Earth’s Surface
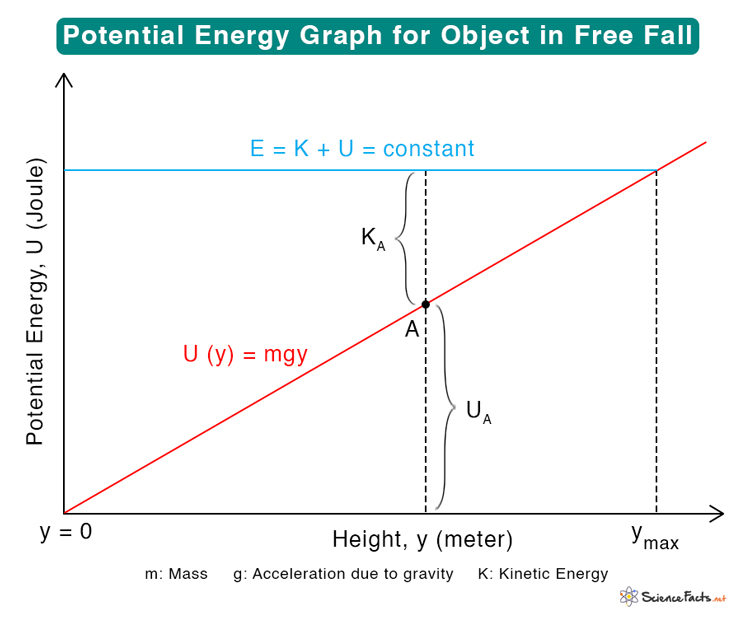
An object subjected to a free fall near the surface of the Earth will experience acceleration due to gravity. Its potential energy at a given height from the surface is
U(y) = mgy
Where
U(y): Potential energy
m: Mass of the object
g: Acceleration due to gravity
y: Height above the Earth’s surface
The above equation is a straight line passing through the origin with slope mg, as shown below.
The sum of kinetic and potential energy at any given point A is constant and equal to the object’s total mechanical energy.
E = UA + KA = constant
Where
E: Total energy of the object
KA: Kinetic energy of the object at A
UA: Potential energy of the object at A
The dashed line in the image represents the total energy at point A. It is clear from the graph that the total energy is divided between kinetic and potential as the object’s height changes. The part below A shows the potential energy, and the part above A shows the kinetic energy.
Since the kinetic energy cannot be negative, a certain height exists where the potential energy is maximum. It can be deduced from the following inequality.
K = E – U(y) ≥ 0
At this maximum height, the potential energy equals the total energy, making the kinetic energy zero. We denote this height as ymax.
K = E – mgymax = 0
=> ymax = E/mg
Kinetic energy can be written as a function of the object’s mass and velocity.
K = ½ mv2
At y = ymax, the kinetic energy is zero. So, when an object is thrown upwards, its velocity becomes zero at the maximum height before changing direction and falling downward. The object passes through a turning point.
At ground level, y = 0, and the object comes to rest. Here, the potential energy is zero, and the kinetic energy and the speed are maximum. Let us represent the maximum speed as vmax. The energy equation can be rewritten as
Here, vmax is the object’s final velocity just before it hits the ground. It is also the initial velocity required to throw the object upward such that it reaches a height ymax.
Horizontal Spring-Mass System
Consider a spring-mass system on a frictionless, horizontal surface. Since the surface is horizontal, gravity and normal force do not affect the system’s motion. Imagine that the spring oscillates about a point, which we call the origin. Suppose x represents the amount by which the spring has stretched. The value of x at the origin is zero. The following expression gives the spring’s potential energy as a function of its displacement.
U(x) = ½ kx2
Where
U(x): Potential energy
k: Spring constant
x: Distance by which the spring is displaced from the origin
The above equation is plotted graphically and shown below. We see a parabola with its vertex at the origin. The motion of the mass is confined to two extreme positions, +xmax and -xmax. We call these extreme positions turning points.
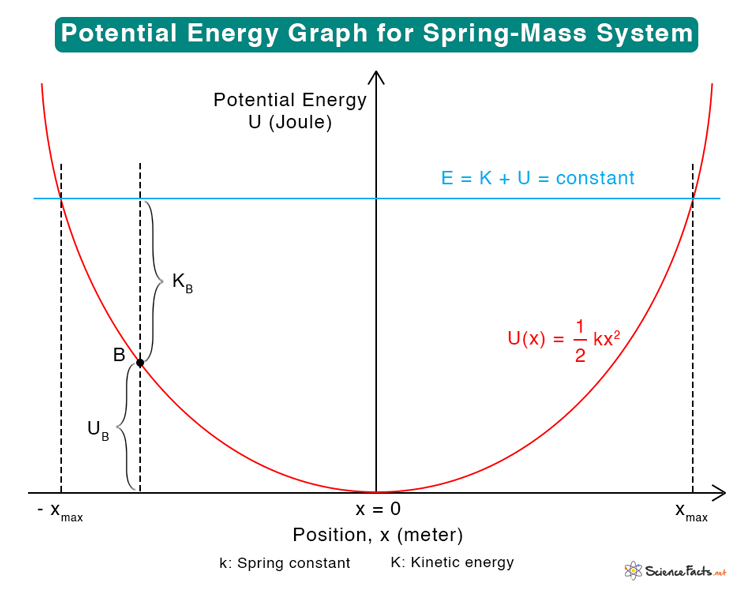
Consider point B on the curve. The total energy at point B is
E = UB + KB
Where
E: Total energy of the system
UB: Potential energy at B
KB: Kinetic energy at B
As in the case of free fall, the total mechanical energy at this point is constant. The above equation sets limits on the kinetic energy and velocity.
0 ≤ K ≤ E
At the turning points, the kinetic energy is zero, and the potential energy is ½ k(xmax)2. Therefore,
The motion of the mass is confined to
The potential energy is bounded with respect to x. For this reason, the potential energy curve is called a “well”. At the bottom of the well, x = 0, U = 0, and K = E. Therefore, the kinetic energy is maximum, and the corresponding velocity vmax is given by
Where m is the mass of the object attached to the spring.
The spring force F on the object can be deduced from the potential energy. It is the negative derivative of the potential energy with respect to the displacement.
The graph shows that the force is minimum or zero at x = 0. This point is called the equilibrium point. U(x) has a minimum at the equilibrium point. The force on either side of the equilibrium point can be derived by integrating the above equation, which gives
F = ± kx
The direction of the force is such that it points toward the equilibrium point. Hence, it is known as the restoring force. At the turning points, the force is maximum (Fmax = ± kxmax). It means that the object is very unstable, its potential energy is maximum, and the restoring force will bring it back to its equilibrium position.
-
References
Article was last reviewed on Tuesday, January 10, 2023
Related articles


Join our Newsletter
Fill your E-mail Address